Data & Intelligence / systems model
Business Intelligence
Implement interactive, enterprise-wide reporting dashboards and data visualization tools that simplify complex metric tracking.
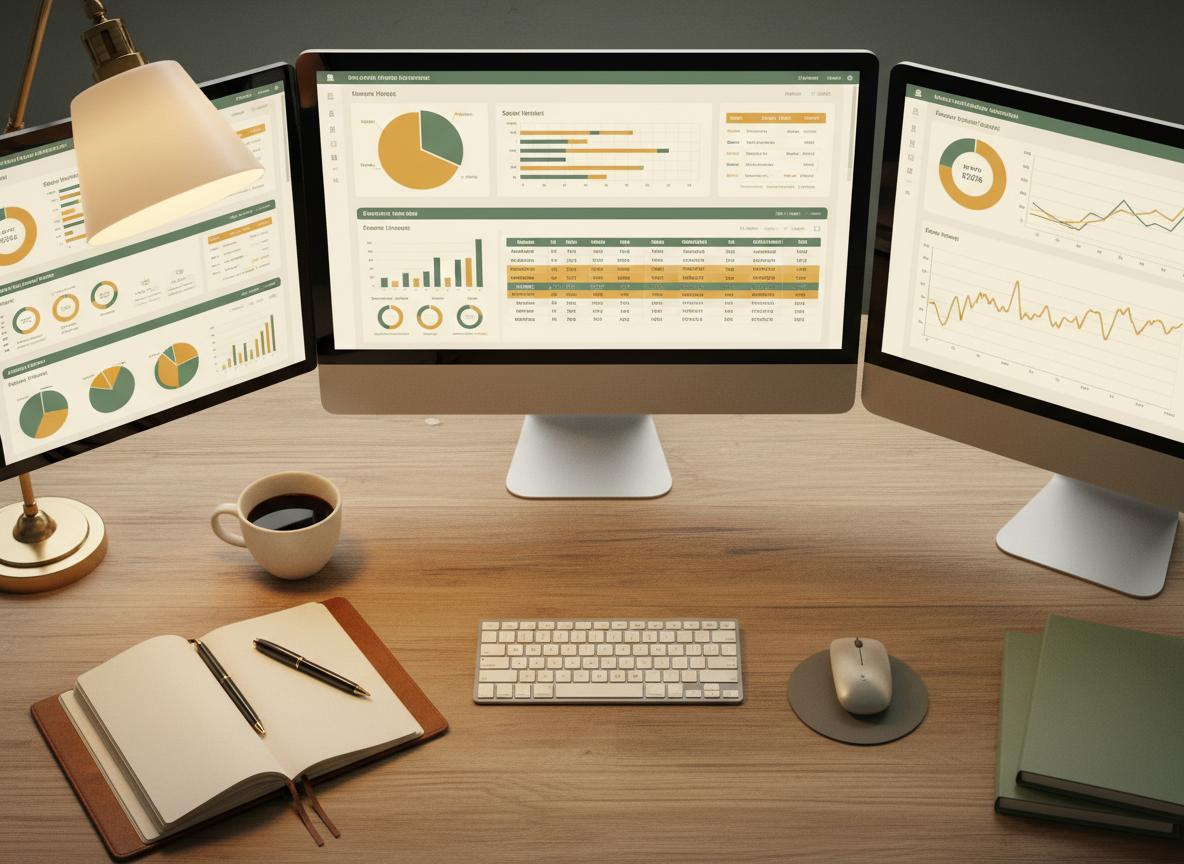
Service overview
We implement comprehensive Business Intelligence (BI) platforms that visualize your KPIs in real-time, allowing teams to monitor performance and spot trends instantly.
By designing clean, intuitive dashboards and setting up automated reporting, we democratize data access across your organization, moving from manual spreadsheets to automated visual intelligence.
Business challenges
- 01
Hours wasted manually compiling spreadsheets for weekly or monthly management reviews.
- 02
Decision-makers unable to access performance data without requesting IT support.
- 03
Inconsistent and confusing visualization of key operational and financial metrics.
Approach
We design semantic data layers that unify metrics definitions across all dashboards.
Our team crafts highly visual, intuitive dashboards tailored for different management levels.
We automate report delivery, scheduling updates and configure real-time threshold alerts.
Process
- 01
Dashboard Design
We mock up intuitive visual layouts based on user roles and core KPI requirements.
- 02
Semantic Layer Build
We configure semantic data models to ensure calculations are uniform across all reports.
- 03
Visualization Coding
Our engineers build the dashboards, connecting them to live database sources.
- 04
Alert Configuration
We set up automated schedules and alerts to notify users of significant metric shifts.
Technologies
PowerBI
Tableau
Looker
SQL
Expected benefits
- Real-time visibility into enterprise KPIs, eliminating lag in performance tracking.
- Self-service dashboard capabilities, allowing business users to run custom reports.
- Complete elimination of manual report building, saving hundreds of engineering hours.
- Standardized visual standards that make reports easy to interpret and act upon.
Frequently asked questions
Start a conversation